Our websites use cookies. By continuing, we assume your permission to deploy cookies as detailed in our Privacy Policy.
5 Real-Time Analytics Use Cases with Google Analytics
The online world is very competitive and hard to survive whether you are a content based website or an E-commerce store. It’s hard to thrive in the online world if you don’t track, analyze and report your website data. Using Google Analytics is the way to make these happen. You can easily analyze your customers or visitors’ behavior and which parts of your Brick and Mortar store perform better.
Staying in touch with your customers and taking actions according to their interests to increase your revenue become easier in Brick and Morter stores. In an online store, analyzing your customers is difficult since you don’t know enough information about them, this makes you blind to see ahead.
At this point, analytics tools come into play. Website analytics let you gain information about your customers and understand them. Google Analytics provide you many statistics about your online store and they let you know if your marketing efforts are good enough or not.
You can easily determine important metrics and KPIs for your online store in order to thrive and survive by analyzing data from your visitors.
As I said, using Google Analytics in your E-commerce or content website is essential in order to track your customers’ behavior and analyze their actions to optimize your website and increase your revenue. So, how Google Analytics track and measure your performance?
There are plenty of features that Google analytics provide to track and measure your performance, but I will show 4 essential metrics to gain insight about Google Analytics:
- Real-Time Reporting
- E-commerce Tracking
- Goals
- Average Visit Duration & Bounce Rate
1) Real-Time Reporting

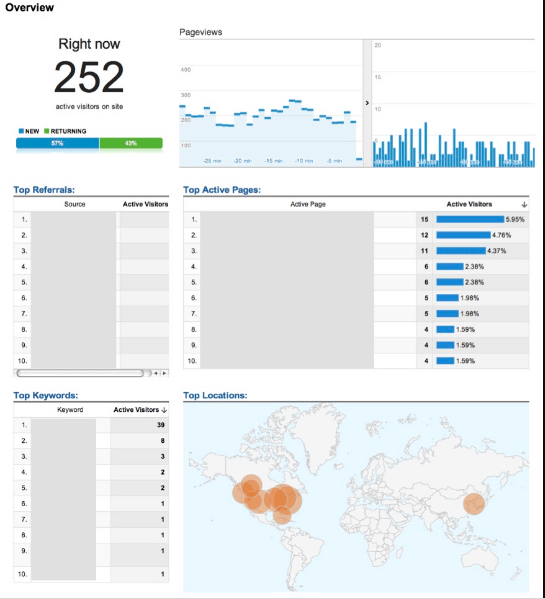
Google Analytics’ real-time reporting feature allow you to see monitor your website in real-time. You can easily monitor your website traffic, which pages are attracted by customers, what they’re browsing and whey they come from at that moment.
Also, you can measure your campaigns, events, social media posts’ performance and if they’re driving traffic to your website or not. There are six reports in real-time reporting:
- Traffic Sources: This real-time report let you monitor the percentage of active users on your website who are attracted by your event or campaign.
- Locations: This report shows your active users’ geographic locations on your website and you can easily monitor how many pages are viewed from each location. This report shows the performance of the locations during the last 30 minutes.
- Content/Screens: Content/Screens report enables you to which pages or content are viewed more in last 30 minutes. By clicking Pageviews/Screenviews, you can see the total number of page views.
- Overview: This report gives you the most of the information about your website, it shows referrals, pages that users entered to website and their locations.
- Events: Events report allows you to monitor your events’ performance in real time. There is an events report table and it shows top 20 event categories in last 30 minutes.
- Conversion: This report shows you goals that your active users completed. This report includes goals table that shows you 20 goals that active visitors completed in last 30 minutes.
2) E-Commerce Tracking
It’s important to know where your potential customers come from. Google Analytics’ E-commerce tracking feature let you know where they come from, so you can take actions in order to increase your potential customers. It lets you monitor your website’s transaction and revenue number. E-commerce tracking features let you:
- get more detailed statistics about transactions on your website
- increase your ROI by providing detailed customer and product reports
- report and track your campaigns’ performance
- measure your order value
- track your pages, events, social interactions, user timings and screens
Just set up the Google Analytics E-commerce Tracking and you can easily show a relationship between your sales data and website usage data. You can check here to set up E-commerce Tracking to your website.
3) Goals

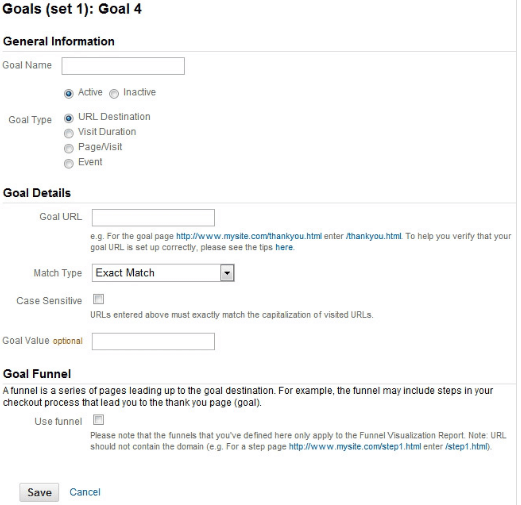
Defining your Goals for your website in Google Analytics is a perfect way to measure your users’ specific actions completion. Defining your goals properly will let Google Analytics offer you a great information like conversion rate and the number of conversion of your website. It provides 4 types of goals:
- Tracking a specific URL so you can see URL’s traffic performance.
- Measure visit duration of your visitors. If you want to increase the time that users spend on your website, setting up a visit duration goal for a specific page can show you the performance.
- Tracking the number of pages that each visitors see before they leave from your website.
Setting up events and select them as a goal. So you can track many Google Analytics events such as widget usage, external links etc.
4) Average Visit Duration / Bounce Rate
Having a high bounce rate means that your visitors tour on your website but they abandon your website without interacting with your website. High bounce rate can be caused by your site design, page load time, bad content etc.
Not to miss your potential customers, you should optimize your website and engage your customers with your brand. To improve your bounce rate, you can calculate the average time spent and bounce rate by implementing Google Analytics to your website, reducing your page load time, optimizing your website’s design and sharing good content for customers’ satisfaction. Now, it’s time to show you 5 Google Analytics use cases.
1) The Next Web Case Study
The Next Web is found in 2006. Founders Boris and Patrick were searching an event so that They can present their startup. They decided to host their own event because they couldn’t find a proper one for themselves.
They noticed that they need a place for promoting the event and started The Next Web blog. The first objective was increasing the traffic of website. Then, they started to add promoting messages about the conference. They were using different messages and measuring the performance of each message.
As we discussed before, conversion is about your aims, what do you want to achieve, your goals. For The Next Web, it is about increasing number of attendees on their event. They used different messages to sell more tickets.
2) The Watchfinder Case Study
Watchfinder is UK-based eCommerce website which sells watches and also opened a brick-and-mortar store in the London Royal Exchange. Their customers’ purchase decision was taking days, weeks, sometimes months. Their agency Periscopix analyzed visitors and created 20 lists about potential customers. Mainly, lists were focused on who are these people and what products they are interested in.
They targeted their campaigns according to these analyses. The purpose was shortening the purchase duration and increasing the number of purchases.
3) Pelican Water System Sees 130% Higher ROI with Google Analytics
In this article, Michael Loban talks about how Pelican Water System’s ROI increased 130% by using Google Analytics.
By using Google Analytics, they got better reports about how they generated offline orders by online marketing campaigns.
They realized that 15% of overall conversions were influenced by Google Adwords.
4) How Nissan Uses Ecommerce Tracking Without Directly Selling Online
In this article, author tells about How Nissan use E-commerce Tracking feature of Google Analytics effectively. Nissan used E-commerce tracking for visitors that submit a test drive request and gain more information about customers’ demands and satisfaction.
By using e-commerce tracking, Nissan gained much information about customers’ demands and analyzed this information to know about their cars’ popularity, reduce the time to summarize the reports by using custom reports and for a better decision making.
5) Marketo Case Study
Marketo is a software that enables its users to automate their marketing processes. Marketo’s marketing processes are aiming to increase conversions. In order to segment their potential customers, they used two-step analysis. Firstly, they used Marketo’s Real Time Personalization and examined visitor behaviors. Then, used these data on the Google Analytics to get insights.


