Shortly after you submit the form, one of our team will contact you to organise a time for your demo. Thank you!
By the time this article will be published, we will have less than a month to migrate to GA4 as Universal Analytics is being replaced by GA4 on July 1, 2023. The transition to GA4 may be overwhelming for some due to the terminology changes between the two versions. That is why we have compiled this GA4 glossary—to assist digital marketers in comprehending the modified terms and the new additions.
Attribution
An important analytics metric for digital marketing campaigns, attribution lets you control how to give credit to the various marketing channels that led to the action taking place. In other words, attribution gives you control over how to define conversion for particular campaigns.
If you’re using last-click attribution, for example, the last action the user took will get the credit, which is what Universal Analytics did. GA4, on the other hand, uses data-driven attribution. Data-driven attribution looks at and analyses all the action the user has taken to end up at your website.
Let’s illustrate this difference between the attribution models with an example: If a user clicks on a paid TikTok ad 6 times and then returns to your website using Google search and makes a purchase, Universal Analytics would attribute this conversion to organic traffic, overlooking all previous activity. However, GA4 will take into account the previous visits through the ad as well and will attribute the conversion to both paid TikTok and organic website visit.
Average Engagement Time
GA4, unlike Universal Analytics, focuses on engagement instead of bounce rate. Average engagement time replaces the average time on site metric from Universal Analytics. It is the average time that users have spent on your website, excluding any time when the website was minimised or hidden within a browser window. Average engagement time is calculated by dividing the total active time of your site by the number of users.
BigQuery Export
With the BigQuery export feature in GA4, you can securely store analytics data in the cloud, enabling you to integrate GA4 data with external data sources and perform queries across multiple datasets. BigQuery offers both free operations and a free usage tier, as well as paid operations.
Cohort Exploration
Cohort exploration in GA4 allows you to analyse specific user groups over time. Cohorts are groups of users with a common characteristic or experience. By creating cohorts based on criteria like acquisition date or engagement, you gain insights into retention, conversion rates, revenue, and other business metrics. This feature provides visualisations and metrics to track cohort behaviour, identify trends, and make data-driven decisions for marketing optimisation and improved user experiences.
Important point to remember is that cohorts and segments are not the same metric. Cohorts focus on analysing the behaviour of specific user groups over time, while segments serve to filter and compare user data across the entire user population based on specific criteria. Cohorts provide insights into group behaviour, while segments enable comparisons and analysis across the entire user base.
Custom Definitions
Custom definitions in GA4 empower you to establish and configure personalised parameters for gathering pertinent data that aligns with your business or website requirements. They offer enhanced versatility in tracking and evaluating data beyond the pre-existing event and user properties provided by GA4. This customisation enables you to obtain more comprehensive insights into user behaviour, engagement, and performance, leading to a deeper understanding of your audience.
Custom Dimensions
Custom dimensions are used to collect additional information or context about events or users. They allow you to define specific dimensions to capture data such as user preferences, user types, product categories, or any other custom information you wish to track. Custom dimensions offer a more detailed understanding of user behaviour, enabling the creation of intricate segments and audience groups for in-depth analysis.
Let’s say you have an eCommerce website and want to track the payment methods used by users during their purchases. To do this, you’ll create a custom dimension called “Payment Method” and assign values such as Credit Card, PayPal, Apple Pay, or Cash on Delivery to capture the payment method chosen by each user. This custom dimension allows you to analyse user behaviour based on payment preferences and gain insights into the most popular payment methods on your website.
Custom Metrics
Custom metrics in GA4 serve the purpose of measuring and monitoring customised numerical data that goes beyond the default metrics offered by GA4. For instance, you have the option to create custom metrics to track metrics like revenue per user, engagement scores, or any other specific metric that holds significance for your business. By utilising custom metrics, you gain the ability to measure and analyse distinctive data points that are not readily available in GA4’s default set of metrics.
Now let’s say you have a mobile gaming app and want to monitor the average level reached by players. To accomplish this, you can create a custom metric called “Average Level” and assign values representing the level achieved by each player. This custom metric will allow you to measure and analyse the average level of player progression, providing insights into user engagement and their game performance.
Data Stream
In Google Analytics, a data stream refers to the continuous flow of data that originates from your website or app and is sent to Google Analytics for analysis. When you place a tracking code on your website or app, it establishes a data stream. Each property you create in Google Analytics will have its own unique data stream associated with it.
In GA4, you have the ability to set up multiple data streams within a single property. This feature is particularly valuable when you have diverse platforms, such as a website and a mobile app, and you desire separate tracking and analysis for each platform.
Furthermore, GA4 provides distinct reporting and analysis capabilities for each data stream. This means that you can access dedicated reports and insights for each data stream within your property, enabling you to focus on individual streams and evaluate their performance separately.
Default Reporting Entry
A typical user interacts with your business using different devices and platforms. For example, I might browse through your app on an iPhone at breakfast and later purchase something from your website using my laptop and through the browser. Although each activity would count as a different session, GA4 allows you control over how unique individuals are identified in reports, unifying them into a single cross-device user journey.
You can monitor users by User ID, Google signals and device, or by device only. If you don’t set up User ID reporting or use Google Signals, then your default reporting entity will be by device only.
eCommerce Purchase
GA4 tracks purchases instead of “transactions”. A purchase is recorded whenever an individual successfully completes the process of buying a product or service on your website. Each eCommerce purchase can include detailed information about total purchase value, items purchased, and other relevant data.
Engaged Sessions
GA4 defines an engaged session as a session that lasts longer than 10 seconds, has a conversion event, or has at least 2 pageviews or screenviews. These criteria help identify sessions where users demonstrate active involvement, indicating higher levels of engagement with your website or app.
Engagement Rate
The engagement rate is the percentage of engaged sessions on your website or mobile app. It is calculated by dividing the total number of sessions by the number of engaged sessions.
Let’s consider a scenario where a user lands on your website, briefly scans some content for less than 10 seconds, and then exits without triggering any events or visiting additional pages. In this case, since the user does not meet any of the criteria for an engaged session as explained above, this session would not be classified as an engaged session. If this were the only session on your website following a similar pattern, it would result in a 0% engagement rate and a 100% bounce rate.
Engaged Sessions Per User
Engaged sessions per user is calculated by dividing the total number of engaged sessions by the number of unique users. It provides a measure of how actively and frequently users engage with your website or app on an individual basis.
Monitoring engaged sessions per user over time and comparing it to industry benchmarks or your own historical data can offer valuable insights, allowing you to make data-driven decisions and implement targeted strategies to enhance the overall user experience, encourage deeper engagement, and achieve sustained growth in user engagement levels.
Enhanced Event Measurement
Enhanced measurement in Google Analytics allows you to measure interactions with your content by enabling options (events) within the Google Analytics interface without changing your tracking code. The events in question are:
GA4 defines events quite differently than Universal Analytics. Any engagement with your website or app is now called an “event”, whereas in Universal Analytics, interactions were tracked as “hits”.
The following types of events are collected automatically by GA4:
Automatically collected events refer to events that are automatically gathered without any additional configuration when you initially set up Google Analytics on your website or app.
Enhanced measurement events are events that are captured when you enable enhanced measurement in your Google Analytics setup for your website or app. These events are specifically collected when enhanced measurement is activated.
The following event types are not collected automatically, so to view these events in Analytics, you must implement them yourself:
Recommended events are implemented with predefined names and parameters. By using recommended events, you unlock existing and future reporting capabilities within Analytics.
Custom events are defined by you to suit your specific needs. Custom events should be created only when other pre-existing events do not serve your use case. Note that custom events do not appear in most standard reports. To conduct meaningful analysis on custom events, you will need to set up custom reports or explorations.
The “event count” metric in GA4 provides the total number of tracked events. In certain reports, it is accompanied by a dropdown menu, allowing you to select a specific event and view its corresponding data in a table format. This feature enables more focused analysis and examination of individual event data within the reports.
Event Parameter
Event parameters in GA4 are utilised to provide additional context to the events that occur on a website. They allow you to include specific details related to an event, such as the name of an embedded video or the duration of time a user spent watching a video on the website.
Events Per Session
Events per session represents the average number of events recorded per session. This calculation is obtained by dividing the total number of events by the total number of sessions. It provides insights into the level of user engagement and interaction within each session, indicating the extent to which users are actively interacting with your website or app during their visits.
Explore
In Google Analytics 4, there is a new section called “explore” that allows you to construct custom reports (known as “Explorations”) and funnels using tables and graphs. When creating a custom report, you have the option to start with a blank template and build a report from scratch, utilise a free form format, visualise a funnel, or explore user paths. This feature provides flexibility in creating tailored reports and visualisations to analyse and understand specific aspects of your data within GA4.
Explorations Snapshots
Explorations snapshots in GA4 are summary snapshots of explorations that can be created either from scratch or from templates. These snapshots provide a concise overview of the exploration’s findings and insights. By default, these summary snapshots are private, ensuring that they are only accessible to the creator or authorised users.
First User Medium
First user medium represents the first source or channel that led the user to visit the website for the first time. This metric provides insights into the various marketing channels or mediums that are driving new user acquisition and can help identify the most effective channels for attracting new visitors.
First User Source
First user source is similar to first user medium, but it focuses specifically on the source from which the user clicked through to your website. It provides information about the specific referral sources, such as search engines, social media platforms, or other websites, that drove the initial traffic to your website for a new user. This metric helps you understand which specific sources are generating the highest quality traffic and allows you to optimise your marketing strategies for better results.
Funnel Exploration
Funnel exploration in GA4 enables you to visually analyse the progression of user actions and assess their success or failure at each step of a specific task. By utilising funnel exploration, you can gain valuable insights into user behaviour and identify potential bottlenecks or areas of improvement within a user journey. This feature provides a clear visualisation of the sequential steps users take, allowing you to evaluate the conversion rates or drop-off rates at each stage.
Google Signals
Google Signals is a feature in GA4 that enables the collection of cross-device data for enhanced demographic reports and audience list creation in Google Ads. By enabling Google Signals, marketers gain valuable insights into user engagement and behaviour, tracking how users interact with a website or app across different devices. This cross-device data allows for a more comprehensive understanding of user journeys, enabling marketers to optimise their advertising strategies and deliver more personalised and targeted experiences to their audiences.
Life Cycle
Life cycle is a new reporting section in GA4 that focuses on the different stages of user journeys on your website. It provides insights into the current position of your users in their interaction with your site, offering reports on key aspects such as user acquisition, engagement, monetisation, and retention.
Measurement ID in GA4 corresponds to tracking ID in Universal Analytics. Each data stream within GA4 has a distinct measurement ID. The measurement ID follows a specific format, starting with “G-” followed by a combination of letters and numbers. This unique identifier is associated with a particular data stream and allows you to accurately track and analyse the data specific to that stream within your GA4 property.
Monetisation Reports
In GA4, instead of eCommerce reports found in Universal Analytics, you have monetisation reports. These reports focus on tracking and analysing the financial aspects of your website or app. You will find these key reports under the “monetisation” section:
Overview: Provides an overview of the monetisation performance, including revenue, conversion rates, and other relevant metrics.
eCommerce purchases: Tracks and analyses the data related to purchases made on your website.
In-app purchases: Focuses on tracking and analysing the data related to purchases made within your mobile app.
Publisher ads: Provides insights into the performance and revenue generated from ads placed on your website or app.
Path Exploration
Path exploration in GA4 enables the exploration of a user’s journey through a tree graph visualisation. This graphical representation helps in identifying patterns, optimising user flow, and improving the overall user experience by understanding how users navigate and interact with your digital property.
Property
A property in Google Analytics is a container that brings together data from multiple streams to create a unified set of reports. It serves as a centralised entity within a Google Analytics account, allowing you to collect and analyse data from various sources, such as different websites, mobile apps, or other digital platforms.
By consolidating the data streams under a single Property, you can access comprehensive reports and insights that provide a holistic view of your digital presence. This enables you to track and measure performance across different channels and platforms, gain valuable insights, and make data-driven decisions to optimise your online presence.
Traffic Acquisition Report
The traffic acquisition report, located under the “acquisition” section, shows where new and returning users come from. In other words, it helps you understand where your traffic is coming from, including direct visits, organic search, referrals, social media, paid advertising, and more. This report should not be confused with the user acquisition report, which only shows new users.
User Acquisition Report
The user acquisition report provides valuable insights into how new users discover and access your website or app for the first time. Unlike the traffic acquisition report, which focuses on the sources of new sessions regardless of user status, the user acquisition report specifically examines the channels and methods through which new users are acquired.
On 27 April, Segmentify and Launch came together for the latest edition to eCommerce Growth webinars: From Data to Revenue.
The webinar consisted of two parts:
Using Real-Time Analytics to Increase ROI with Melisa Çakır from Segmentify
The following are our notes from the first half of the webinar.
Meet Melisa Çakır Suskun
Formerly the Director of eCommerce for brands like Decathlon and English Home, Melisa Çakır Suskun currently works as the VP of Account Management at Segmentify.
Segmentify is a Customer Engagement Platform that creates omnichannel personalised experiences for each user throughout their entire digital journey to increase conversions, engagement, revenue and customer lifetime value.
This is Melisa’s favourite quote:
“Without data, you’re just another person with an opinion.”
W. Edwards Deming
Leveraging Real-Time Analytics with Segmentify Analytics
Segmentify Analytics is an advanced analytics tool designed to provide real-time insights into the performance of individual products on your website. It offers a comprehensive range of data, including total views, purchase counts, click-through rates from various channels, and the number of times a product has been added to the cart. This tool conducts thorough data analysis across product, brand, and category dimensions to deliver comprehensive and actionable information.
Segmentify Analytics currently reports 15 analyses and reports that can be used to develop social media, paid channel marketing, affiliate marketing, on-site marketing, cross-channel automation strategies, or even stock planning.
Let’s take a look at one example real-time analytics report and see how this particular report can be translated into action:
Segmentify Analytics Reveals Inefficiencies in Paid Channel Marketing
Melisa begins her lecture by shedding light on a crucial issue faced by businesses: High spending products failing to convert despite heavy investment in paid channels.
The highlighted products in this report are those that receive substantial traffic from paid channels such as Google Ads, Facebook/Meta ads, and Instagram ads. These are the products that companies eagerly promote and invest significant resources into for advertising purposes.
Source: Segmentify
However, the alarming revelation in the report she shows is that despite the high investment and traffic generated, these products are not delivering the desired results in terms of conversions. In other words, they are not translating into actual sales. This poses a significant challenge, as the primary expectation from promoting products through paid channels is to see a conversion into sales.
What Actions to Take to Optimise Paid Channel Marketing
The first step Melisa recommends is to thoroughly examine the content of the ads, including banners, text, and overall messaging. Ensuring that the ads align coherently with the landing page is crucial. If considerable traffic is driven to the website but no conversions, it suggests a potential mismatch between the ad and the landing page. Checking and rectifying this discrepancy can significantly improve conversion rates.
Another aspect to consider is pricing. Visitors arriving at the website through ads have shown interest in the product, and competitive pricing is an essential factor in their decision-making process. If high traffic fails to convert, reevaluating the pricing structure, such as offering discounts or adjusting prices, may prove beneficial in driving conversions.
Additionally, examining the content on the landing page is essential. This includes product images, catchy taglines, and product names that should be relevant to the ad. Ensuring the content is aligned with the messaging and expectations set by the ad can enhance user engagement and increase conversion rates.
A critical consideration is maintaining adequate stock levels, particularly for products in high-demand categories like fashion and sports. Lack of stock availability for popular sizes or variants can hinder conversions. Ensuring sufficient stock is available for these sought-after items can eliminate this potential conversion barrier.
For more information on how to use Segmentify Analytics for YOUR sustainable growth, reach out to us.
Lastly, businesses should consider excluding non-converting products from paid channels. Continued investment in products that fail to generate revenue is an inefficient use of advertising budgets. By redirecting funds towards high-converting products, businesses can improve their return on ad spend and increase overall conversion rates.
Closing Remarks
Implementing strategies based on real-time analytics can lead to higher conversion rates, better targeting of traffic from paid channel marketing, and increased revenue generation. The insights shared by Melisa about Segmentify Analytics and the importance of real-time analytics provide businesses with actionable steps to optimise their marketing efforts, ultimately boosting their success and growth.
If you have more questions about Segmentify Analytics and how its real-time analytics reports can help your business’ particular needs, shoot us a message. We’ll gladly discuss this at length and give you a test run. Cheers.
Have you ever considered that you might be leaving money on the table by ignoring website engagement data?
Don’t worry if the phrase “engagement data” leaves you feeling lost and confused —you’re definitely not alone. It’s easy for businesses to overlook the importance of tracking engagement data, but doing so can mean missing out on valuable insights into the customers’ behaviour.
But fear not!
This article will illuminate the importance of website engagement data and show you how it can help you boost your online presence and accelerate your growth.
Key Takeaways
Engagement data is typically used to measure the amount of time a website visitor spends on different pages, with higher numbers indicating greater interest. However, it’s important to note that engagement data encompasses a range of other metrics beyond just time spent on a page.
Click data and engagement data are different types of analytics that are often mistaken for one other. And while click data can show which pages receive the most attention, it does not necessarily indicate which pages are most valuable.
To gain valuable insights into visitor behaviour and preferences, digital marketers should analyse both click data and engagement data when evaluating website performance.
What’s Engagement Data?
Engagement data is commonly defined as the metric that shows how much time a website visitor spends on various pages. And as the amount of time spent on a given page usually correlates with interest, higher numbers can be interpreted as better engagement.
Although engagement data does capture how much time visitors spend on various pages, it’s essential to recognise that it can also comprise many other metrics. These metrics may consist of scroll depth (how far down the page visitors scroll) or time spent watching videos, among many others.
By expanding your understanding of engagement data to include these various metrics, you can provide a more comprehensive explanation of why tracking engagement data is crucial, which we’ll get to in a second.
Examples of Key Website Engagement Data Points to Capture
Any digital marketer who’s worth their salt should know to look for a variety of metrics to understand website engagement data. Only by analysing these metrics can one gain insights into how visitors interact with the website and make data-driven decisions to improve engagement and drive more conversions.
1. Session Duration
Session duration is a metric that measures the length of time a user spends on your website during a single visit or session. It is calculated from the moment the user lands on the website until they close the browser or after a certain period of inactivity. Analysing this metric helps you better understand how engaging the website is and how interested the visitors are in its content.
A low session duration may indicate that the website is difficult to navigate or the visitors aren’t finding what they came for. Conversely, a high session duration may signal that visitors are highly engaged with your content and find value in what you have to offer.
However, it’s important to note that session duration can vary depending on the type of website and the goals of the visitor.
For example, a news website may have a shorter session duration as visitors quickly browse through articles. In comparison, an eCommerce website may have a longer session duration as visitors spend time browsing through products. Therefore, you should always analyse session duration in the context of your website and its specific goals.
One important question to always ask yourself is: What would make me interested in clicking on a link to another page or screen?
It’s crucial to understand the needs and desires of users as they navigate through each page to create user journeys that have a lasting impact. Crafting a compelling landing page is one way to increase the duration of users’ sessions. By doing so, you can guide them towards the ultimate goal of completing a conversion.
While it’s undoubtedly essential to aim for as many sessions as possible, it’s even more crucial to approach your planning with a growth mindset that prioritises setting clear goals for each session. Approaching your planning with a growth mindset that prioritises setting clear goals for each session will enable you to accurately interpret session duration and make strategic decisions that optimise user engagement and conversion rates.
2. Page per Session
The metric “page per session” shows the number of pages a user views during a single visit and is a valuable indicator of website engagement.
If a visitor is only browsing through one or two pages per session, it may indicate that they are not fully immersed in the content and could be a sign of weak engagement. Conversely, suppose visitors are viewing a higher number of pages per session. In that case, they find the content interesting and relevant, indicating stronger engagement and a greater likelihood of taking desired actions on your website.
3. Bounce Rate
Bounce rate is the percentage of visitors who leave the website after viewing only one page. And contrary to what one might expect, a high bounce rate is not a digital marketer’s worst nightmare. At the moment, a digital marketer’s worst nightmare is probably being replaced by ChatGPT, but I digress.
A high bounce rate may indeed indicate a low-engaging website, which might result from weak content or poor UX. Slow loading times, irrelevant content, or a lack of clear calls-to-action…They all lead to high bounce rates.
Still, a high bounce rate is not always a negative indicator of engagement. Suppose a visitor lands on a website, finds the exact information they were searching for, and then leaves. This would still count as a bounce. Additionally, it’s quite common for websites like news sites or blogs to have high bounce rates. In such cases, scroll-depth might be a more useful metric to check to understand website engagement.
4. Scroll Depth
As its name suggests, scroll depth is a website engagement metric that shows how far visitors scroll down a page. A higher scroll depth indicates that visitors are engaged and reading more of the content.
Scroll depth can help digital marketers determine whether visitors are finding the content interesting enough to continue engaging with. For instance, if visitors are scrolling to the bottom of a page, it suggests that they are finding the content compelling and are interested in consuming all the information available. In contrast, if visitors are only scrolling a short way down the page, it may indicate that the content is not resonating with them or is not presented in an engaging way.
By analysing the scroll depth data, digital marketers can identify which webpage sections are being viewed the most and which are being ignored. This information can then be used to adjust the page layout, reorganise content, or add more engaging elements to increase visitor engagement and encourage them to scroll further.
5. Click-Through Rate (CTR)
Click-through rate is an analytics metric that shows the percentage of users who click on a specific link or button on the website. CTR can help indicate how effective calls-to-action (CTAs) are in prompting users to take a desired action.
A high CTR is generally seen as a positive indicator of website engagement because it shows that people who see the ad or link find it relevant and compelling enough to click on it. A low CTR, on the other hand, can suggest that the ad or link is not resonating with the intended audience or that there may be issues with ad targeting or placement.
6. Conversion Rate
Conversion rate measures the percentage of visitors who take a desired action on your website, such as filling out a form or purchasing. Digital marketers place such high value on conversion rate because it directly correlates to revenue and other key business goals.
A higher conversion rate indicates that the website effectively engages users and prompts them to take desired actions. A low conversion rate, in contrast, suggests that the website may need to be optimised to meet visitors’ needs and interests better.
Conversion rate can be influenced by a variety of factors, such as the design and layout of a website, the quality and relevance of its content, the ease of navigation, and the clarity of its CTAs. Therefore, digital marketers must continually test and refine their strategies to optimise conversion rates and achieve better results.
7. Returning Users
The metric “returning users” refers to visitors who have previously visited the website and are now returning for another visit. Keeping track of returning users is essential as it provides valuable insights into the audience’s overall engagement and loyalty towards the website.
Website owners can use returning user tracking to understand the behaviour and preferences of their audience over time, enabling them to enhance the website’s content, design, and user experience.
Additionally, analysing returning user behaviour can provide insights into the effectiveness of marketing campaigns and other promotional efforts. For instance, if a considerable percentage of returning users arrive at the website through a particular marketing channel or campaign, it suggests that the campaign successfully engages the intended audience.
Monitoring returning users and sessions is crucial in website engagement analytics because it offers valuable insights into audience behaviour, preferences, and loyalty. This data can be leveraged to enhance the website’s performance and effectiveness.
Difference Between Engagement Data and Click Data
Engagement data and click data are two similar but distinct types of analytics that often get confused. Click data, such as CTRs, is a popular metric website owners use to measure page performance and effectiveness. However, relying solely on click data without considering engagement data can lead to a misinterpretation of a visitor’s interests and preferences.
To illustrate this, let’s imagine you’re in the market for a new car and decide to visit an automobile showroom. You have three kids, so you’re primarily interested in a minivan to accommodate your family’s needs. However, when you walk into the showroom, you can’t help but notice the shiny sports car on display, and you might even take a closer look at it. You might also glance at other options, such as a new model of your old car or a large SUV.
From a showroom salesperson’s perspective, this behaviour might seem confusing or even misleading. However, suppose they pay attention to your engagement data. In that case, they will be able to see that your primary interest lies in the minivan, as evidenced by the amount of time you spend looking at it and asking questions about it.
Similarly, on a website, engagement data provides a more complete picture of a visitor’s interests and preferences beyond just which pages they clicked on. It can include metrics such as time spent on a page, scroll depth, or even how a visitor interacts with certain elements on the page. By analysing engagement data, website owners can gain insights into what truly captures their visitors’ attention and use that information to personalise their online experiences and increase engagement and conversions.
Therefore, it’s important to track both click data and engagement data to gain a complete understanding of your visitors’ behaviours and interests. Like a showroom salesperson who pays attention to your behaviour and interests, website owners can use this information to improve the customer experience and drive business success.
Why Click Data Alone Isn’t Enough to Measure Website Effectiveness
When measuring a website’s effectiveness, digital marketers often rely on click data to determine which pages receive the most attention. However, time spent looking at different products can be just as valuable, if not more so.
Let’s return to the “sports car” page on an automobile showroom’s website. While it may receive a lot of clicks and attention, it may not necessarily be the most valuable asset for the dealership. Visitors may simply be drawn to the page out of curiosity or entertainment rather than be actually interested in purchasing the sports car.
In such cases, CTAs become crucial tracking tools to determine which pages are actually driving conversions. However, not all pages may have CTAs that make sense, and engagement data still holds significant value in assessing the effectiveness of these pages.
For instance, if a particular page isn’t receiving any clicks, analysing the engagement data can help identify whether the content leading up to the CTA is falling short, resulting in minimal engagement, or if the offer itself is the issue despite high engagement levels.
Another element to consider when analysing click data is the product purchase cycle or frequency. The purchase cycle is the period between two purchases of the same product by a customer. For example, if a customer buys a bottle of shampoo every 30 days, then the purchase cycle of the shampoo is 30 days.
Regarding click data, the purchase cycle of a product is a crucial factor to consider. For instance, a candy with a short purchase cycle is expected to have lower clicks than a TV with a longer purchase cycle. This is because the frequency of purchases influences the user’s behaviour and how frequently they interact with the website.
Understanding a product’s purchase cycle helps design marketing campaigns that cater to the customer’s buying behaviour. For instance, if a product has a longer purchase cycle, the marketing campaign should focus on building brand loyalty and keeping the customer engaged with the brand until they are ready to make another purchase. On the other hand, if a product has a short purchase cycle, such as candy that is purchased instantly, the marketing campaign should focus on promoting the product and driving quick conversions.
Overall, digital marketers need to consider both click data and engagement data when analysing website performance, as both metrics provide valuable insights into visitor behaviour and preferences.
How to Accurately Keep Track of Website Engagement Data
As we’ve discussed so far, keeping track of website engagement data is essential to optimising website performance and UX. By utilising these methods, you can accurately track website engagement data and gain valuable insights into how users interact with your website. This allows you to optimise it for a better user experience and higher conversions.
1. Use Website Analytics Tools
The most common way to track website engagement data is by using website analytics tools such as Google Analytics, Segmentify Analytics, Adobe Analytics, or Piwik. These tools provide comprehensive insights into user behaviour, including the number of visitors, their location, the pages they visit, the time they spend on the website, and more.
2. Use Customer Engagement Platforms
Customer engagement platforms are valuable tools that provide digital marketers with a comprehensive view of website engagement data, helping them optimise the UX, improve conversions, and drive business growth.
A customer engagement platform, such as Segmentify, offering advanced segmentation and personalisation capabilities that allow digital marketers to create targeted campaigns based on specific visitor behaviour and preferences, can help improve engagement and conversion rates by delivering a more personalised and relevant experience to website visitors.
3. Set Up Custom Event Tracking
Event tracking allows you to track user actions on your website, such as clicks on buttons or links, form submissions, or video views. By monitoring events that matter and are aligned with your goals, you can gain a better understanding of user behaviour and optimise your website and its content accordingly.
4. Monitor Scroll Depth
As discussed earlier, monitoring scroll depth can provide valuable insights into how users interact with your website’s content. Tools like Hotjar and Crazy Egg allow you to track scroll depth and analyse user behaviour.
5. Use Heat Maps
Heat maps provide a visual representation of user behaviour on your website, showing which areas of the page are getting the most clicks, taps, or attention. Tools like Hotjar, Crazy Egg, and ClickTale offer heat mapping capabilities.
6. Conduct User Surveys
Conducting user surveys can help you understand why visitors engage with your website or why they don’t. You can use tools like SurveyMonkey, Typeform, or Google Forms to create and distribute surveys to your website visitors.
On April 27, Segmentify and Launch came together for the latest edition to eCommerce Growth webinars: From Data to Revenue.
Everything You Need to Know About GA4 Ahead of July 1 with Ian Lewis from Launch
The following are our notes from the latter half of the webinar.
Meet Ian Lewis
Starting his digital marketing career in SEO, Ian Lewis is currently working as an Analytics Director at Launch. Launch is a paid media agency offering digital advertising, data insight and conversion optimisation services to clients looking to take their marketing to the next level.
Oh, and Ian loves a good spreadsheet.
Change is the Only Constant: A Brief History of Google Analytics
Change is an inherent and ever-present aspect of life; it is a constant. From the tiniest atoms to the largest galaxies, everything is in motion and constantly changing. Naturally, this state of flux and transformation also applies to technology.
Source: Launch
Google Analytics started when Google acquired Urchin, an analytics company, back in 2005, which led to the creation of GA1, a synchronous loading analytics tool. However, this caused problems with tracking and bounce rates, so they moved to GA2, which was asynchronous and loaded all the code at once.
Universal Analytics, or GA3, introduced enhanced user tracking and eCommerce tracking. Then in 2020, GA4 was introduced, which combines website and app data, allowing for tracking of user journeys from app to website and vice versa.
Why You Should Switch to GA4
The change from Universal Analytics to GA4 is mainly due to the need for a more holistic view of the user journey, which includes tracking from app to website and across different devices, as well as privacy concerns and the phasing out of third-party cookies.
GA4 combines all platforms and uses machine learning to provide more valuable and up-to-date information. It also works with Google Ads to improve ad campaigns’ efficiency.
Source: Launch
Additionally, as Ian points out in plain language, Universal Analytics will be gone entirely, and all data will eventually be deleted, making GA4 the only option for tracking data.
Universal Analytics will be completely phased out, with data collection stopping on July 1. After that, all data will be stagnant, and a complete deletion of Universal Analytics will follow. Users will receive notifications with a 6-month warning stating that all Universal Analytics data will be deleted on a specific date, leaving only GA4 as the tracking option.
Don’t Compare Universal Analytics and GA4
Ian emphasises that comparing Universal Analytics to GA4 is fruitless since there’s a reason why they are different.
“If you’re seeing loads of sessions on one particular channel in Universal Analytics and you’re not seeing it in GA4, just remember that it’s probably being tracked differently.”
Ian Lewis, Analytics Director at Launch
He points out the necessity of embracing the change. It is, after all, ever-present in all corners of life. Google Analytics has come a long way since Google acquired Urchin in 2005. Universal Analytics came because the previous versions weren’t meeting the then-current needs of marketers and website owners.
And now, GA4 needs to come in because cookies will no longer be a thing, and users keep going back and forth between the app and the website, which needs to be considered in tracking website engagement analytics.
“What GA4 is doing is trying to streamline everything, make sure it’s cookie-compliant, make sure it’s ready for a cookieless world and link all three devices for you—iOS, Android, with your apps as well. So it’s not complicated if you use it for what you need to use it for.”
Ian Lewis, Analytics Director at Launch
Closing Remarks
Ian Lewis’ final advice about GA4 to marketers and analysts is as follows:
Speak with your marketing team, web agency, or marketing agency regarding the tracking setup you have in GA4. Inquire whether they are satisfied with the current setup and its configuration.
Take some time to explore GA4 and get acquainted with its features. Begin considering the data you want to track and gather to support your paid activities. If you don’t see a particular metric or information in GA4, remember that it may be possible to create an event for it and track it within GA4.
It’s essential to prepare for the eventual discontinuation of UA by Google. They have announced that they will delete all UA properties and views with six months’ notice. In a worst-case scenario, if your UA is deleted on July 2, you will have at least until the end of the year to transition. If you’re relying on UA data regularly, such as pandemic-related data from previous years, know that it will eventually be deleted. Therefore, it’s advisable to plan where that data will be stored if you need it.
Knowing your customers’ favourite snack or drink can be the difference between them clicking “buy” or “bye-bye.”
Personalisation is a vital ingredient to success in the world of eCommerce. By understanding your customers’ preferences, you can tailor your offerings to meet their needs and create a positive shopping experience that keeps them coming back for more. Whether it’s their favourite snack, drink, or even the colours they prefer to wear, taking the time to personalise the experience can be the key to building strong customer relationships and driving sales growth.
So, buckle up and get ready to slay the eCommerce game with personalisation!
Key Takeaways
eCommerce personalisation is the display of dynamic content based on unique information about a customer, such as demographics, browsing history, past purchases, and browsing device to tailor the shopping experience.
This strategy offers several benefits, such as improving the customer experience, increasing sales and conversion rates, and encouraging repeat purchases.
However, eCommerce personalisation also has some challenges, including data privacy concerns, adapting to zero-party and first-party data, and data collection and implementation.
To overcome these challenges, companies must invest in appropriate data management tools and staff and be transparent about their data collection practices to build customer trust.
What is eCommerce Personalisation?
A personalised eCommerce experience is one where an online store displays dynamic content based on the unique information about a customer. A user’s demographics, browsing history, past purchases, and browsing device can all contribute to eCommerce personalisation.
Or, in BigCommerce’s words,
“eCommerce personalisation lets you treat each customer like a VIP.”
3 Benefits of eCommerce Personalisation
Considering that customers today have hundreds of options to shop from, eCommerce personalisation can make the difference between customer retention and abandonment. Let’s take a look closer look at why personalisation is important:
1. Improved Customer Experience
Personalised product or content recommendations, promotions and offers help customers narrow down their choices, saving them from decision exhaustion. To illustrate, nearly 40% of customers leave a website because they are overwhelmed by too many options.
It is imperative that websites provide personalised experiences if they offer different products that appeal to different demographics.
The more personalised your online store is, the higher the likelihood of a sale. That’s because customers are able to cut through the clutter and find exactly what they want, making the purchase more likely.
For example, a personalised homepage has a lower bounce rate because the content is curated according to the shopper’s behavioural pattern, such as browsing and purchasing history.
3. Greater Customer Lifetime Value
eCommerce personalisation allows marketers to adapt continuously to ever-changing customer needs and do so at a scale. Personalisation also encourages repeat purchases by keeping customers constantly in the loop, leading them from awareness to action.
eCommerce Personalisation Statistics
70% of consumers say a company’s ability to understand their individual needs influences their loyalty.
Personalised recommendations increase the likelihood of a purchase by 75%.
58% of cosmetics & beauty customers would prefer to purchase from a brand providing personalised quizzes or experiences.
78% of consumers are more likely to repeat purchases from brands that provide personalisation.
Companies can generate up to 40% more revenue with personalised marketing actions.
Challenges with eCommerce Personalisation
Data Privacy Concerns
Third-party data, the data that’s not directly collected from the individual, used to be a massive help with data collection, eCommerce personalisation and retargeting.
In time, however, the public started declaring their concerns over data privacy louder and louder, which led to regulations and laws like GDPR (General Data Protection Regulation) and CCPA (California Consumer Privacy Act) being enacted to ensure that data tracking is done with the individual’s consent.
Interpreting the signals from consumers and lawmakers as a sign to change their ways, companies like Google and Apple started stopping cross-app data sharing and eliminating third-party cookies altogether.
Adapting to Zero-Party & First-Party Data
The term zero-party data refers to data that your company receives directly from your customers, such as purchase intentions, personal content, how an individual wants to be contacted by a brand, etc.
First-party data is the information a company collects directly through its own channels and sources like mobile apps, websites, social media, SMS, email, and more.
The good thing about zero-party is that it’s accurate most of the time since it’s explicitly provided by the customers. And the good thing about first-party data is that the website in question is the only entity with that information—it’s unique.
Why are these considered a challenge then?
As mentioned, companies got pretty used to working with third-party data; they’re sort of out of shape in dealing with zero-party or first-party data. So they will need time and practice in collecting and using these.
Another angle to consider here is transparency and trust-building. With zero-party data, customers are directly sharing their personal information, which they’re already concerned about to begin with. Hence, companies must learn to be transparent about their data collection practices and use them ethically to build customer trust.
Data Collection & Implementation
Additionally, collecting and managing zero-party and first-party data can be complex and time-consuming, requiring specialised skills and technology. Companies must invest in appropriate data management tools and staff to collect, store and analyse the data effectively.
Top-tier brands such as Puma, Ebuyer, Intersports, Celtic, Samsung, Carrefour, Mediamarkt, and IKEA opt to collaborate with Segmentify as our solutions allow them to tailor and adapt on-site and cross-channel marketing campaigns.
Our technology allows websites to identify and interact with individual visitors in real-time and on a large scale, which enables them to provide the most suitable experience and modify their journeys based on changes in behavioural data.
Integrating Segmentify with any website is a quick and straightforward process that only requires adding two lines of JS code — no IT team is necessary. The Segmentify Success Team handles the setup of widgets and performs the essential tests. As a result, your campaigns can be up and running within days!
Data Quality
Personalisation relies heavily on data accuracy and completeness to deliver tailored experiences that meet customers’ preferences and needs. Bad data can refer to any inaccurate, incomplete, or irrelevant information about customers, products, or operations that can negatively impact a business’s ability to make informed decisions or deliver high-quality service.
A business with inaccurate or incomplete customer data may struggle to create personalised product recommendations, targeted marketing campaigns and customised shopping experiences.
For example, if a customer’s purchase history is incomplete or inaccurate, a business may struggle to provide recommendations relevant to their interests. Similarly, if a customer’s shipping address is incorrect, their order may not be delivered, resulting in a negative customer experience.
On the other hand, accurate and complete data can enable eCommerce businesses to provide highly personalised experiences that increase customer loyalty, satisfaction, and sales. By ensuring that customer data is accurate and up-to-date, companies can create a more comprehensive understanding of their customers’ preferences and behaviours, leading to more effective personalisation strategies.
Wrapping Up
eCommerce personalisation is now a widely accepted practice in the industry and is essential for any business aiming to attract and retain customers and stay ahead of the competition. The personalisation process begins with gathering customer data, identifying key customer segments, analysing this data to comprehend the intent of each segment, and delivering personalised journeys for each one.
FAQs About eCommerce Personalisation
What is eCommerce personalisation?
eCommerce personalisation is the practice of tailoring the online shopping experience for individual customers based on their preferences, behaviour, and other relevant data.
Why is eCommerce personalisation important?
Personalisation can help improve customer satisfaction, increase customer loyalty, and ultimately drive sales and revenue growth for eCommerce businesses.
What kind of data is needed for eCommerce personalisation?
eCommerce businesses typically collect data such as customer demographics, purchase history, browsing behaviour, and other relevant metrics to help personalise the shopping experience.
How can eCommerce personalisation be implemented?
eCommerce personalisation can be implemented through various techniques such as product recommendations, personalised email campaigns, customised landing pages and targeted advertising.
What are some common challenges with eCommerce personalisation?
Some common challenges with eCommerce personalisation include data privacy concerns, difficulty in collecting and analysing data, and the need to balance personalisation with customer privacy and trust.
How can eCommerce businesses measure the effectiveness of personalisation efforts?
eCommerce businesses can measure the effectiveness of personalisation efforts through metrics such as conversion rates, average order value (AOV), and customer lifetime value (LTV), among others. A/B testing and customer feedback can also be useful in evaluating personalisation efforts.
What are some best practices for eCommerce personalisation?
Some best practices for eCommerce personalisation include using data to understand customer behaviour and preferences, providing relevant and timely product recommendations, personalising email marketing campaigns, and ensuring that personalisation efforts align with customer privacy and trust concerns.
What’s the difference between personalisation and customisation?
Customers can tailor a product to their preferences through customisation, including changes to colour, size, and other features. On the other hand, personalisation involves an algorithm that identifies the customer’s search intent, browsing behaviour and demographic information (such as age, location, and income) to curate a digital experience specific to their needs.
Although we have appreciated the values of sustainable development since our company was established, we have decided to present our stand towards sustainable development professionally in 2022.
Supported by the training on Sustainable Development and SDGs by experts from academia, we have identified the specific SDG targets during an SDG analysis. We ensured that our company policy includes our SDG targets, and our business actions link to the targeted SDGs to indicate our contribution to sustainable development. Our SDG report is also validated by the experts and the members of executive management to enhance broad engagement.
The meeting of all the United Nations Member States in 2015 for the 2030 Agenda for Sustainable Development has been a turning point for our planet, people, prosperity and universal peace. The 2030 Agenda, a global action plan to end poverty and hunger, protect the planet from climate change and pollution, and ensure inclusive and just societies, addresses the Sustainable Development Goals (SDGs) and calls on all countries and stakeholders to act in a collaborative partnership for humanity and the planet.
As a result of the analysis, we have identified 12 SDGs where our impacts are directly or indirectly positive and one SDG where our impact is indirectly negative. There are also 4 SDGs that we believe we do not have any impact on. However, with our sustainability strategy, specifying the SDGs that we will have the most impact on, we will go on further in our sustainability journey to save the people, planet, prosperity and peace.
We would like to present our special thanks to Dr. Nese Soysal from Edu4GlobAll Consultancy for providing our team with the training on Sustainable Development Goals and preparing our SDG Report.
Chief Executive Officer’s Review
Segmentify was born to provide improved Artificial Intelligence solutions for eCommerce businesses in 2015. We always seek ways to develop our algorithms and release cutting-edge technology.
The COVID-19 pandemic in 2020 has severely disrupted the world economy and people’s way of life. We have realised it will continue with us for the foreseeable future, and taking action towards protecting our planet, prosperity and people is essential. Our company policies include working towards contributing to the United Nations Sustainable Development Goals.
We aim to accomplish our sustainability goals by 2030 and become a fully sustainable company. Our sustainability goals include contributing to our planet, people, and prosperity.
Planet
As SDGs stated, we should protect our planet “so that it can satisfy the requirements of the present and future generations”. We are becoming increasingly aware of how fundamentally linked global development to climate change is.
Even a small action can contribute to our environment. We are aware of the climate crisis around the world and hope to have a positive impact with our company strategy.
People
The SDGs state that everyone on earth is committed to “ensuring that all people may realise their full potential in dignity, equality, and a safe environment” At Segmentify, we put people first; our employees, customers and society are at the heart of our company. We provide a dynamic learning environment for our employees. We care about their personal development, mental health and work skills improvement.
Our employees are put first regarding their equality and education opportunities. We have made our student and employee training programs our company policy; we hope to improve their personal and professional skills.
Prosperity
The SDGs were created to “guarantee that all people may have successful and satisfying lives and that economic, social, and technical growth proceeds in balance with nature.” One of the defining challenges of our age is inequality, which calls for a focus that has, up to now, yet to be present.
As a technology company, we believe in the importance of having equal representation. As an equal opportunity employer, we do not discriminate regardless of gender, sexual orientation, race, or religion. Additionally, we organise several events yearly to support women entering the technology industry.
Furthermore, there are still areas where students cannot reach a quality education, especially from the practical aspect of technology. The educational inequalities have discouraged many young people from entering the technology industry. We have a specific programme for students and provide them with technology, development, sales, and marketing training.
Finally, we believe that with all of the points mentioned above, we can positively impact our future as a company. We will continue to grow our sustainability goals and implementations in the following years. Representing our dedication to SDGs, we welcome all our new team members, business partners and customers by planting a tree in cooperation with various NGOs worldwide.
The United Nations Sustainable Development Goals stay at the centre of Segmentify’s growth strategy and company culture. The SDG Report will increase our transparency to our stakeholders and investors. We also expect it will guide and encourage other companies to begin their own journeys to SDG achievement for a sustainable world.
Murat Soysal, CEO
Segmentify’s Impact on SDGs (2022)
Methodology
For the preparation of our SDG report, the following steps were taken as a team:
We had training about Sustainable Development and Sustainable Development Goals during the process.
To identify our impact on SDGs, the data on our strategies is collected through interviews with Segmentify’s senior management team and document analysis.
The data is analysed by experts with the support of our team, and Segmentify’s sustainability picture has been drawn.
At the same time, we have worked on our sustainability policy to include what we have done and what else we can do to achieve UN SDGs.
Our report has been produced with its validation through experts, our stakeholders and our executive management team.
SDG Reporting Methodology
In assessing our impact, we considered the social value principles determined by Social Value International in 2021.
SDG Impact Assessment Steps
In assessing our impact on SGDs, SDG Impact Assessment Tool Guide 1.0, prepared by the Gothenburg Centre for Sustainable Development at the Chalmers University of Technology and University of Gothenburg Sustainable Development Solutions Network (SDSN) Northern Europe (2020), is used as a guide.
Segmentify’s Direct Positive Impacts on SDGs
SDG 1: No Poverty
Segmentify supports the United Nations Sustainable Development Goals and prioritises “SDG 1: No Poverty” to end poverty in all its forms everywhere.
Commitments: Segmentify is committed to supporting specifically “SDG 1.4”, aiming to ensure all men and women have equal rights to economic resources.
SDG 3: Good Health & Well-Being
We support the United Nations Sustainable Development Goals and prioritise “SDG 3: Good Health and Well-being” to ensure healthy lives and promote well-being for all ages.
Commitments: We are committed to supporting specifically “SDG 3.8”, aiming to provide access to quality essential healthcare services and access to safe, effective, quality and affordable essential medicines and vaccines for all employees of Segmentify.
Action for Change
Segmentify offers private healthcare programmes, diet programs, online fitness membership, and well-being support for all its workers.
Impact in Progress
In 2022, all employees are offered private healthcare programs to ensure they can access quality healthcare services and affordable medicines. Employees can also access online fitness membership and individualised diet programs. Segmentify offers volleyball and football clubs to all employees to encourage good health and well-being.
SDG 4: Quality Education
Segmentify prioritises “SDG 4: Quality Education” to ensure inclusive and equitable quality education and promote lifelong learning opportunities for all.
Commitments: We are committed to supporting specifically “SDG 4.4.” aiming to increase the number of youth and adults who have relevant skills, including technical and vocational skills, for employment, decent jobs and entrepreneurship substantially by 2030.
SDG 5: Gender Equality
As the United Nations highlights, “Gender equality is not only a fundamental human right, but a necessary foundation for a peaceful, prosperous, and sustainable world. Providing women and girls with equal access to education, health care, decent work, and representation in political and economic decision-making processes will fuel sustainable economies and benefit societies and humanity at large.”
For this reason, Segmentify aims to support the United Nations Sustainable Development Goals and prioritises SDGs 5: Achieve gender equality and empower all women and girls.
Commitments: We are committed to “SDG 5.1.1”: Legal frameworks for gender equality and non-discrimination. We are also committed to supporting specifically “SDG 5.5” to ensure women’s full and effective participation and equal opportunities for leadership at all levels of decision-making in political, economic, and public life and have equal access to financial resources.
SDG 8: Decent Work & Economic Growth
We prioritise “SDG 8: Decent Work and Economic Growth” to promote sustained, inclusive, and sustainable economic growth, full and productive employment and decent work for all.
Commitments: We are committed to supporting “SDG 8.5”, aiming to achieve full and productive employment and decent work for all women and men, including young people and persons with disabilities, and equal pay for work of equal value by 2030. We are also to support “SDG 8.6”, aiming to substantially reduce the proportion of youth not in employment, education or training.
Action for Change 1
Segmentify cooperates with KEDV (Foundation for the Support of Women’s Work) in Turkiye. KEDV supports women’s efforts to improve their lives and strengthen their leadership in local development, aiming to contribute to building a strong society where poverty does not exist.
Segmentify supports KEDV by buying presents to be given on any occasion, such as World Women’s Day and New Year celebrations from KEDV. We also work for donations to KEDV.
Impact in Progress 1
In 2022, as the Segmentify running team, we donated 30,054 TL. We enabled 10 women to participate in production within the women’s cooperatives by running with our team of 11 people in the Istanbul Half Marathon. In this way, we ensured that women produced and participated in economic and social life to stop poverty. We also created a fundamental awareness of women’s cooperatives’ role in women’s employment and empowerment.
Action for Change 2
%90 of the Segmentify team lives in Turkiye, where inflation severely affects the cost of living. To help them overcome these unprecedented times, Segmentify has invested in a Salary Analysis Report and identified every employee’s PIR (Position in Range). Segmentify plans to overcome inflation’s acute effects and take salary increase actions accordingly.
Impact in Progress 2
In January 2022, all Segmentify staff with a PIR of %50 or lower had a separate pay rise to a PIR above %50. As of today, %65 of the team has a PIR above %75. Segmentify aims to bring all her staff to %75 PIR in 2023. This way, Segmentify aims to play a role in providing decent work and economic growth and ending poverty.
Action for Change 3
Segmentify launched a 3-month training program for university students called “Internify” in November 2021. It aims to provide opportunities for university students to access high-quality training programmes, on both technical subjects (i.e., coding and design) and business-related subjects (i.e., marketing and sales) by skilled engineers and business people. Students are also provided with real work experiences, and mutually satisfied students are provided with part-time or full-time employment opportunities in Segmentify.
Impact in Progress 3
In 2022, out of a total of 350 applications, 50 students have been trained, 18 of them employed by Segmentify. The total %18 workforce of Segmentify comes from Internify. Segmentify commits to keeping this number above %15 by 2030, aiming to train more university students and employ them substantially.
Action for Change 4
“eCommerce Growth Show” is a podcast series organised by Segmentify since 2019. It aims to build a sustainable community among eCommerce professionals by sharing knowledge of growth strategies. The power of this show also comes from its fighting with poverty and inequalities. In 2020, the eCommerce managers who lost their jobs during the pandemic were invited as guests and had a chance to share their experiences, which supported them in finding their next employers.
In 2022, Segmentify launched a new vertical called “Women in eCommerce”, where different women hosts have women eCommerce managers as guests in every episode. In that way, it became a platform where women’s voices could be heard to guide other women in the area and support their employment.
Impact in Progress 4
It is a community from 11 countries in 7 languages with almost 300 series listened to by more than 10.000 people worldwide.
SDG 10: Reduced Inequalities
Segmentify prioritises SDG 10: Reduce inequalities within and among countries.
We specifically support “SDG 10.2.”, aiming to empower and promote the social, economic, and political inclusion of all, irrespective of age, sex, disability, race, ethnicity, origin, religion or economic or other status by 2030.
Actions for Change
In addition to supporting women and girls for equal access to quality education and decent work with KEDV projects, Internify and Women in eCommerce programmes, Segmentify supports women’s efforts in improving their lives and strengthening their leadership in local development, intending to contribute to building a strong society where inequalities do not exist.
To this end, A Women’s Rights Awareness Workshop was held within Segmentify to create awareness for empowering women and supporting gender equality. We are also ensuring that women are employed in the leadership team and that they produce and participate in economic and social life.
Segmentify works in cooperation with the Women in Tech Academy project funded by the European Union and supported by the Community Volunteers Foundation and Youth Hub, aiming to help young women participate in the workforce in the software industry by specialising in training and contributing to their empowerment.
Segmentify is also the partner of Sister’s Lab Project, an international exchange of trainers and mentors aiming to ensure gender equality and women’s empowerment in the fields of STEAM (Science, Technology, Engineering, Art, Mathematics). As part of this, Segmentify provides mentors and employs the women in the project.
Impact in Progress
Awareness of empowering women and supporting gender equality has been created on the Segmentify team. As a result of the Women in Tech Academy project, out of 3 applications, one woman is employed by Segmentify. Segmentify mentors are still giving training for the project.
In addition, there are 42 women employees in Segmentify as % 36 of the whole employment. The ratio of the women leadership team to men is %25.
As stated in our HR Policy Booklet, Segmentify has legal frameworks in place to promote, enforce and monitor equality and non-discrimination. We are committed to diversity in the workplace and against discrimination of race, colour, religion, age, national origin, disability, gender identity or any other factor. Segmentify also established a zero-tolerance policy towards all forms of workplace violence, verbal and/or physical abuse.
SDG 15: Life on Land
Segmentify prioritises “SDG 15: Life on Land” to protect, restore and promote sustainable use of terrestrial ecosystems, sustainably manage forests, combat desertification, halt and reverse land degradation, and halt biodiversity loss.
We specifically support “SDG 15.2.”, aiming to promote the implementation of sustainable management of all types of forests, halt deforestation, restore degraded forests and substantially increase afforestation and reforestation globally.
Actions for Change
Segmentify has partnered with the Turkish Foundation for Combating Erosion, Afforestation and Conservation of Natural Assets (TEMA). TEMA plants a tree on behalf of every new employee and all guests participating in Segmentify’s eCommerce Growth Show series and awards tree certificates to the participants to combat desertification and manage forests.
Impact in Progress
Up to now, 179 trees have been planted for each employee and 185 trees have been planted for each guest in the eCommerce Growth Show. In return for the tree certificate given to each guest, a total of 3 donations were made to TEMA in 2020 and 2021.
SDG 17: Partnerships for the Goals
Segmentify prioritises “SDG 17: Partnership for the Goals” to strengthen the means of implementation and revitalise the Global Partnership for Sustainable Development.
Segmentify specifically supports “SDG 17.16.”, aiming to enhance the Global Partnership for Sustainable Development, complemented by multi-stakeholder partnerships that mobilise and share knowledge, expertise, technology and financial resources to support the achievement of the Sustainable Development Goals in all countries, in particular developing countries.
Actions for Change
The Segmentify team started having trainings on Sustainable Development Goals from the professionals and enhanced its global partnerships from different countries to support the achievement of Sustainable Development Goals in all the countries we are working with. We also started working with SDG reporting initiatives.
Impact in Progress
Segmentify has members responsible for integrating Sustainable Development Goals into all the company’s actions. We share our knowledge and expertise with our multi-stakeholder partners in the countries we are working with. We have published our first SDG report.
Segmentify’s Indirect Positive Impacts on SDGs
In addition to our direct positive impacts on the SDGs mentioned above, Segmentify has indirect positive effects on SDG2: Zero Hunger, SDG 13: Climate Action, SDG9: Industry, Innovation and Infrastructure and SDG16: Peace, Justice and Strong Institutions.
By creating an impact on SDG1: No Poverty, supporting women to participate in economic life to stop poverty and providing decent work to men and women, Segmentify indirectly supports SDG2: Zero Hunger.
Supporting SDG15: Life on Land to protect forests and combat desertification working in cooperation with TEMA, Segmentify supports SDG 13: Climate Action to take urgent action to combat climate change.
Having an R&D hub, data sharing with universities and some joint projects, Segmentify has some collaborative projects, supporting SDG 9: Industry, Innovation, and Infrastructure.
Segmentify also is committed to SDG 16: Peace, Justice, and Strong Institutions by standing against violence, supporting global peace, and ensuring equal access to justice for all.
SDGs Where Segmentify Has No Impact
Segmentify is committed to achieving United Nations Sustainable Development Goals. Although we are in the progress of achieving many of the stated above, we plan to achieve these SDGs with our future actions:
SDG 6: Clean Water and Sanitation
SDG 7: Affordable and Clean Energy
SDG 11: Sustainable Cities and Communities
SDG 14: Life Below Water
Segmentify’s Direct Negative Impacts on SDGs
Segmentify, as a company providing Artificial Intelligence solutions for eCommerce businesses, has a negative impact on SDG 12: Responsible Consumption and Production. However, we are targeting to support recycling techniques in the future.
Future Targets
Increasing and keeping the percentage of women employees above 45%.
To start a positive effect in SDG 14: Life Below Water, Segmentify is looking forward to cooperating with NGOs, not only with nomination but also helping them via their technical needs from an AI perspective.
Ryanair has a reputation for being one of the most engaging airline accounts on Twitter due to its witty responses to customer inquiries. With over 1.5 million followers, the account regularly posts promotional content, customer service responses, and humorous tweets. Ryanair’s use of humour and wit is a deliberate marketing strategy aimed at engaging customers uniquely.
Key Takeaways
By taking a more unconventional approach to customer service, Ryanair creates a distinctive brand personality and stands out from other airlines.
Ryanair’s use of humour is evident across their social media accounts, where they regularly respond to customer inquiries with witty and sassy remarks.
Ryanair’s approach to customer service not only helps to diffuse potentially negative situations but also generates positive buzz around the brand.
Humour as a Marketing Strategy
Humour has become an increasingly popular marketing strategy for companies looking to engage with customers uniquely and memorably. By incorporating humour into their marketing campaigns, companies can differentiate themselves from competitors and create a distinctive brand personality that resonates with their target audience. Ryanair is an excellent example of a company successfully incorporating humour into its marketing strategy.
Ryanair’s use of humour is evident in their Twitter account, where they regularly respond to customer inquiries with witty remarks. For example, when a customer asked if they could bring a cat on board a Ryanair flight, the account responded with a photo of a cat wearing a pilot’s hat and the message, “we love cats, but only humans can fly with Ryanair.” This response answered the customer’s question and generated laughter and positive reactions from other Twitter users.
Similarly, when a customer complained about being charged for an overweight bag, Ryanair tweeted a picture of a sumo wrestler with the caption, “Just because you’re big doesn’t mean your luggage has to be.” This response diffused the situation and generated a positive buzz around the brand.
Customer Service with a Twist
Ryanair’s customer service team is responsive and informative, but they also incorporate humour and wit into their responses. This approach to customer service not only helps to diffuse potentially negative situations but also generates positive buzz around the brand.
For example, in response to a tweet from a customer who was flying with Ryanair for the first time, the account tweeted a GIF of a baby taking its first steps with the message, “First time flying with Ryanair? Don’t worry; we’ll hold your hand.”
Engaging with Customers
In addition to its customer service interactions, Ryanair’s Twitter account engages with customers through humorous tweets and memes. The account often uses pop culture references and current events to create timely and relatable content.
When the Netflix series “Tiger King” was popular, Ryanair tweeted a photo of a tiger in a plane seat with the caption, “Don’t worry, Joe, we fly tigers too.” This tweet generated thousands of likes and retweets and helped keep Ryanair on the mind of its followers.
Wrapping Up
Ryanair’s Twitter account is an excellent example of how humour and wit can be used as a marketing strategy to engage customers uniquely and memorably. Ryanair has built a strong brand personality that resonates with its target audience by taking a more unconventional approach to customer service and creating timely and relatable content. As a result, the airline has grown its Twitter following and created a loyal customer base that appreciates its humour and wit.
By incorporating humour into their marketing strategy, companies can differentiate themselves from competitors and create a more assertive brand personality that resonates with their target audience.
Our website uses cookies
Our websites use cookies. By continuing, we assume your permission to deploy cookies as detailed in our Privacy Policy.
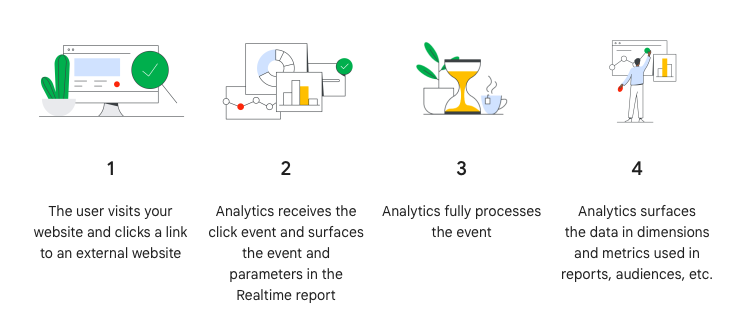
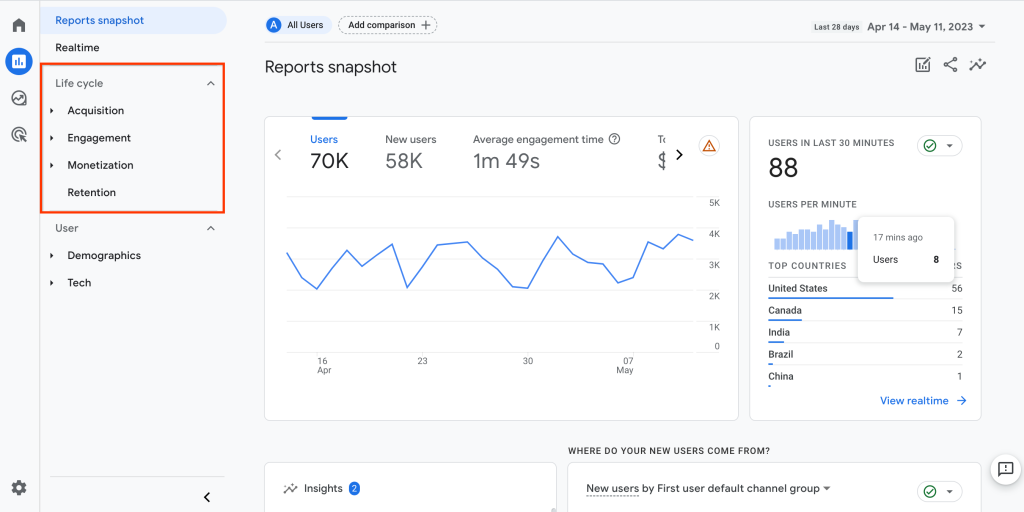
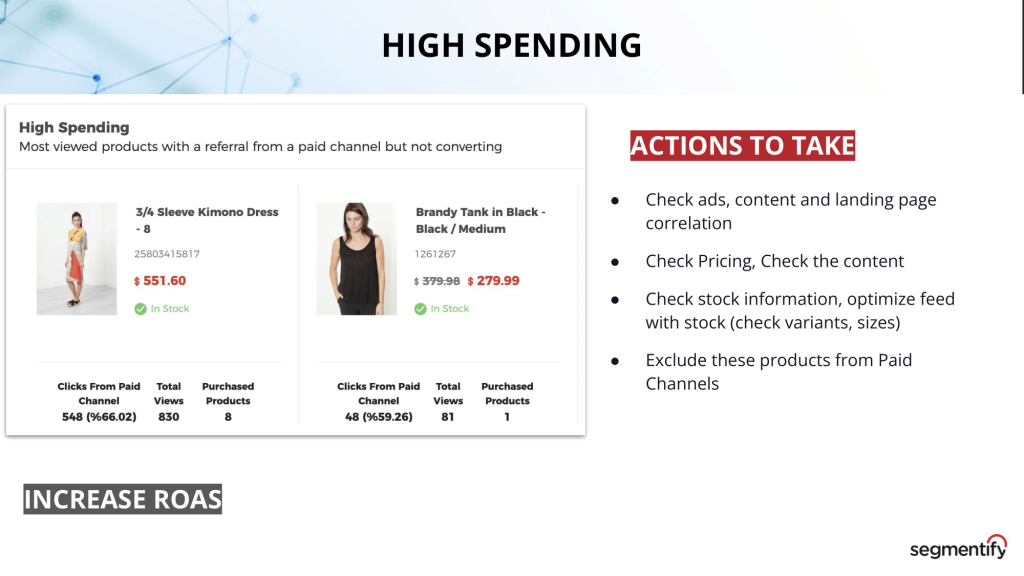
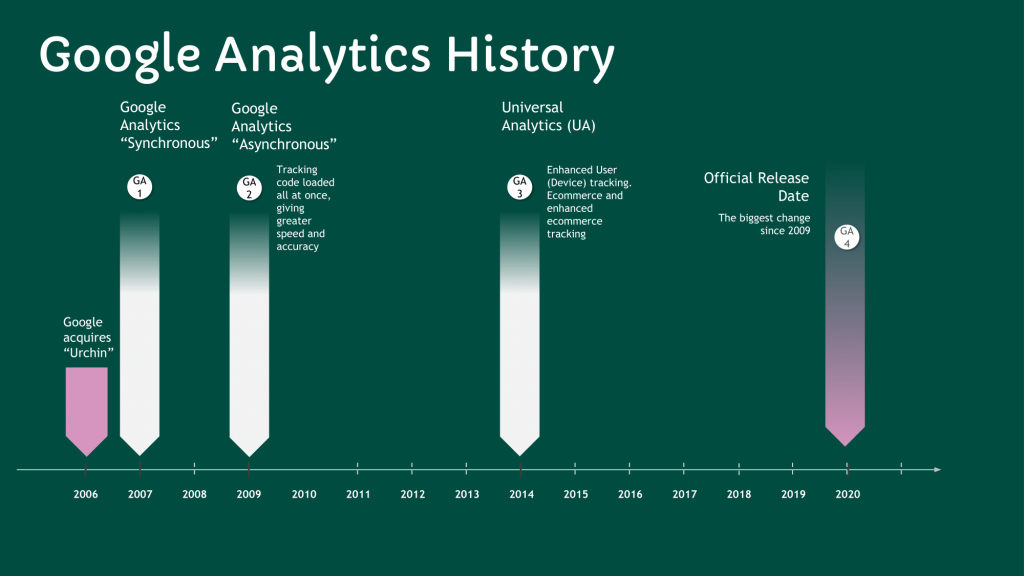
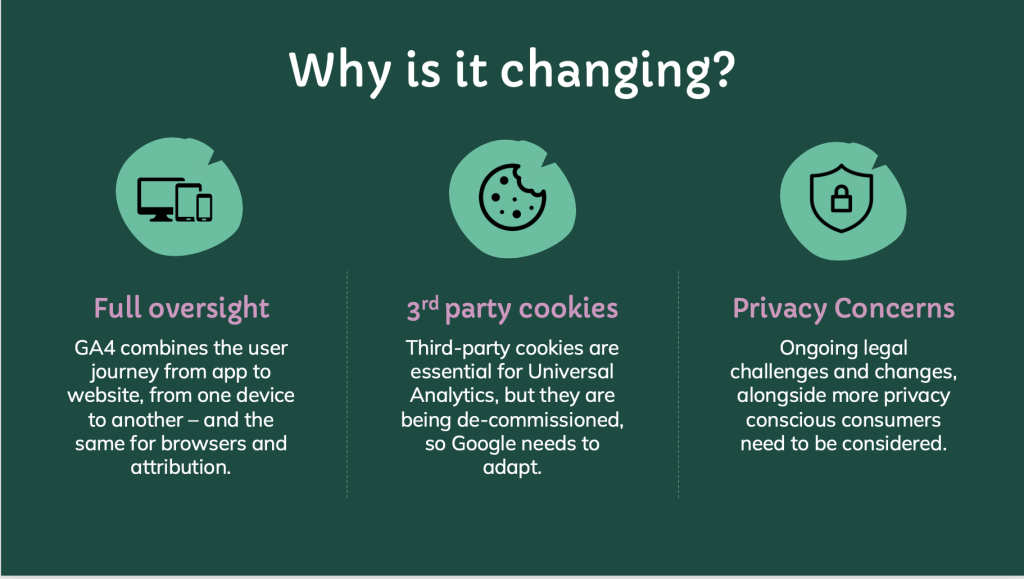

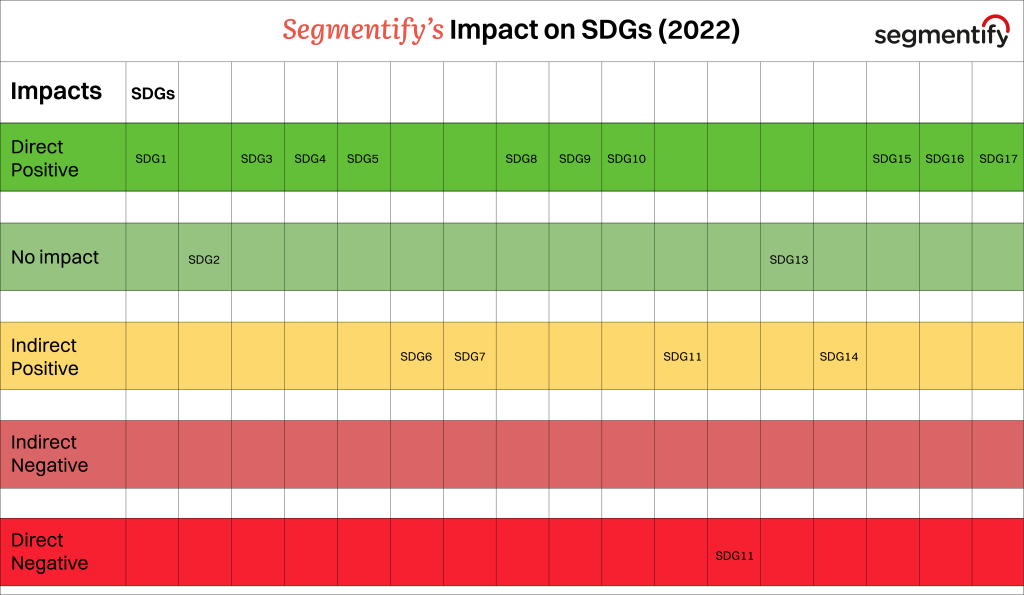
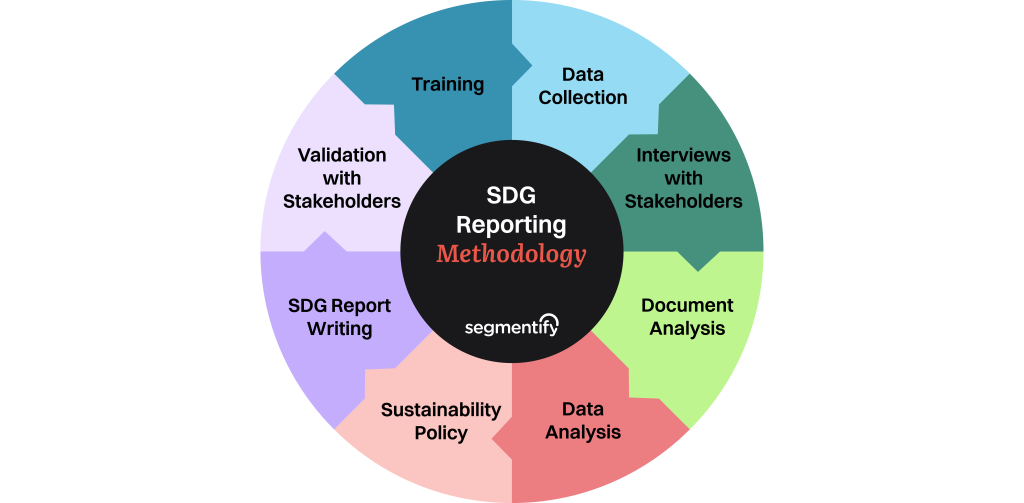
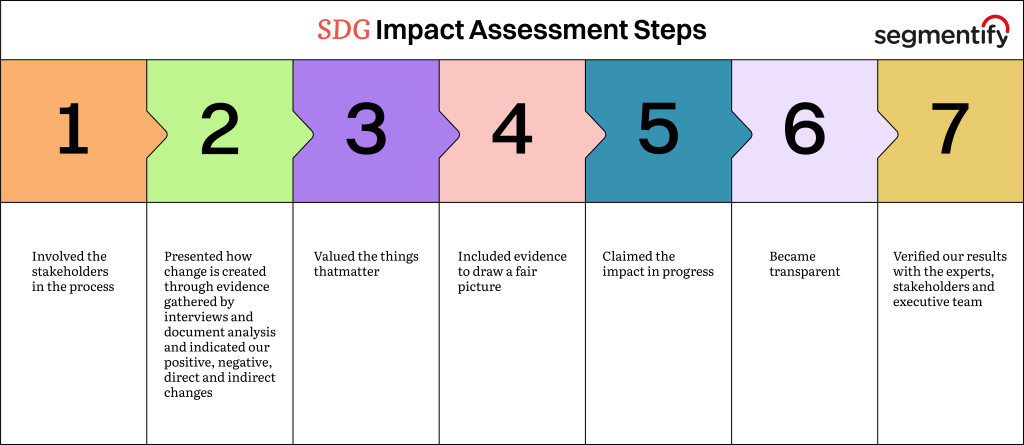


 Engagement Engage customers across all channels
 Recommendation Offer personalised recommendations
 Dynamic Bundles Increase your cross-selling
 Growth & Optimisation Monitor website data in real-time
 Customer Data Management Enjoyable unique customer journeys
 Cross-Channel Marketing Optimise the customer experience
 Search & Discovery Improve your search capabilities
 Growth for All Industries